| ||
| ||
| ||
| ||
| ||
| ||
| ||
|
Thursday, May 3, 2012
Microsoft Vergence
Tuesday, May 1, 2012

Microsoft Amalga
Combine information from many systems, explore data on demand and build out applications as needed to help drive improvements.

Sunday, March 11, 2012

Thursday, March 1, 2012

Monday, November 28, 2011
The R Project for Statistical Computing

The R Project for Statistical Computing
R is a language and environment for statistical computing and graphics. It is a GNU project which is similar to the S language and environment which was developed at Bell Laboratories (formerly AT&T, now Lucent Technologies) by John Chambers and colleagues. R can be considered as a different implementation of S. There are some important differences, but much code written for S runs unaltered under R.
R provides a wide variety of statistical (linear and nonlinear modelling, classical statistical tests, time-series analysis, classification, clustering, ...) and graphical techniques, and is highly extensible. The S language is often the vehicle of choice for research in statistical methodology, and R provides an Open Source route to participation in that activity.
One of R's strengths is the ease with which well-designed publication-quality plots can be produced, including mathematical symbols and formulae where needed. Great care has been taken over the defaults for the minor design choices in graphics, but the user retains full control.
R is available as Free Software under the terms of the Free Software Foundation's GNU General Public License in source code form. It compiles and runs on a wide variety of UNIX platforms and similar systems (including FreeBSD and Linux), Windows and MacOS.
The R environment
R is an integrated suite of software facilities for data manipulation, calculation and graphical display. It includes
- an effective data handling and storage facility,
- a suite of operators for calculations on arrays, in particular matrices,
- a large, coherent, integrated collection of intermediate tools for data analysis,
- graphical facilities for data analysis and display either on-screen or on hardcopy, and
- a well-developed, simple and effective programming language which includes conditionals, loops, user-defined recursive functions and input and output facilities.
The term "environment" is intended to characterize it as a fully planned and coherent system, rather than an incremental accretion of very specific and inflexible tools, as is frequently the case with other data analysis software.
R, like S, is designed around a true computer language, and it allows users to add additional functionality by defining new functions. Much of the system is itself written in the R dialect of S, which makes it easy for users to follow the algorithmic choices made. For computationally-intensive tasks, C, C++ and Fortran code can be linked and called at run time. Advanced users can write C code to manipulate R objects directly.
Many users think of R as a statistics system. We prefer to think of it of an environment within which statistical techniques are implemented. R can be extended (easily) viapackages. There are about eight packages supplied with the R distribution and many more are available through the CRAN family of Internet sites covering a very wide range of modern statistics.
R has its own LaTeX-like documentation format, which is used to supply comprehensive documentation, both on-line in a number of formats and in hardcopy. Learn more about (R)...
Monday, November 21, 2011
After Spirit and Opportunity, Curiosity is ready to Go!
Spirit and Opportunity, Curiosity is powered with radioisotope thermal generators, and is thus not limited by the availability of solar power. However, it will still need to reduce activity during the coldest winter months, when more of its power will be required to keep its instruments warm. It also carries a more sophisticated analytical instrument package than Spirit and Opportunity. Curiosity will assess past habitability by searching for and identifying organic compounds, possible metabolic products of ancient organisms, and studying the rocks for details about the past climate in which they formed. Curiosity carries ten science instruments. What makes the science instrument suite of Curiosity unique are the analytical tools located within the body of the rover, which will perform detailed chemical analyses of about 70 samples of rock and soil delivered to them by the robotic arm. Sample Analysis at Mars (SAM) includes a gas chromatograph, mass spectrometer, and tunable laser spectrometer, and is intended to identify organic compounds and also to measure the isotopic ratios of chemical elements important to life. CheMin is an X-ray diffraction X-ray fluorescence instrument, which directly measures the bulk elemental composition of rocks and soils, allowing scientists to infer mineral composition. read more (planetary.org)
Saturday, November 12, 2011
Pocket Projector for iPhone

Pocket Projector for iPhone is available at a price of $230 only, though it is more worthy than its price tag. Just put your order to company’s site and the projector-case- box will be shipped to you within a week.
That 50-inch image projected buy this magical case would require about 8 feet of empty space to get benefit, as noted by Macworld’s Dan Frakes, who have spent sometime with this cute and remarkable iPhone case.
Frakes notes that the images created by the built-in projector are truly quite excellent, although a dark room is als required to make the best use of this absolutely mini DLP Pico chip.
If you are desirous to pick this Pocket Projector right now, you can put your order through Brookstone official site.
Friday, November 11, 2011
Tuesday, November 1, 2011
Cordon Multi-Target Photo-Radar System

Go easy on the gas, Speed Racer, because Cordon is on its way. Developed by Simicon, this new speed sensor promises to take highway surveillance to new heights of precision. Unlike most photo radar systems, which track only one violator at a time, Simicon's device can simultaneously identify and follow up to 32 vehicles across four lanes. Whenever a car enters its range, the Cordon will automatically generate two images: one from wide-angle view and one closeup shot of the vehicle's license plate. It's also capable of instantly measuring a car's speed and mapping its position, and can easily be synced with other databases via WiFi, 3G or WiMAX. Plus, this device is compact and durable enough to be mounted upon a tripod or atop a road sign, making it even harder for drivers to spot. Fortunately, though, you still have time to change your dragster ways, as distributor Peak Gain Systems won't be bringing the Cordon to North America until the first quarter of 2012. Cruise past the break to see some footage of a field trial that's currently underway -- cars tagged with a green dot are traveling below the speed limit, those with a yellow marking are chugging along within an acceptable range above the limit, while vehicles with a red tab are just asking for trouble.
 |
Tuesday, October 18, 2011

Friday, October 14, 2011
Geiger Counter Kit

Introducing the Geiger Counter Kit from the Maker Shed. This kit costs a fraction of a commercial unit and it works just like you it should, blinking and clicking in the presence of radiation. It takes about an hour to build and even has a serial output for tracking radioactivity over time.
Is Grandma’s pottery or glass collection radioactive? Do bananas give off radiation? Is that granite table given to you by your mother-in-law slightly “hot?” (In my case, yes!) With this Geiger Counter Kit these questions are yours to answer. While this is a functional Geiger counter it is for educational purposes only. Please do not use it for anything important.
Saturday, October 8, 2011

Thursday, October 6, 2011
Good bye Mr.Steve

"Because the people who are crazy enough to think they can change the world, are the ones who do."
Monday, October 3, 2011
Submarine cable system connecting the world

TeleGeography’s free interactive submarine cable map is based on our authoritative Global Bandwidth research, and depicts 188 active and planned submarine cable systems and their landing stations. Selecting a cable route on the map provides access to data about the cable, including the cable’s name, ready-for-service (RFS) date, length, owners, website, and landing points. Selecting a landing point provides a list of all submarine cables landing at that station. more
Sunday, October 2, 2011
Google Maps Feature Lets You 'Helicopter' Preview Routes
Google Maps now includes a cool new feature that lets you preview a route with a 3D bird's eye animation, whether you’re driving, walking, biking, or using mass transit.
To use it, go to Google Maps, click "Get directions," and input your start and end points—just like you would normally. Starting Friday Google has added a small "3D" button next to "Driving directions to (your destination)."
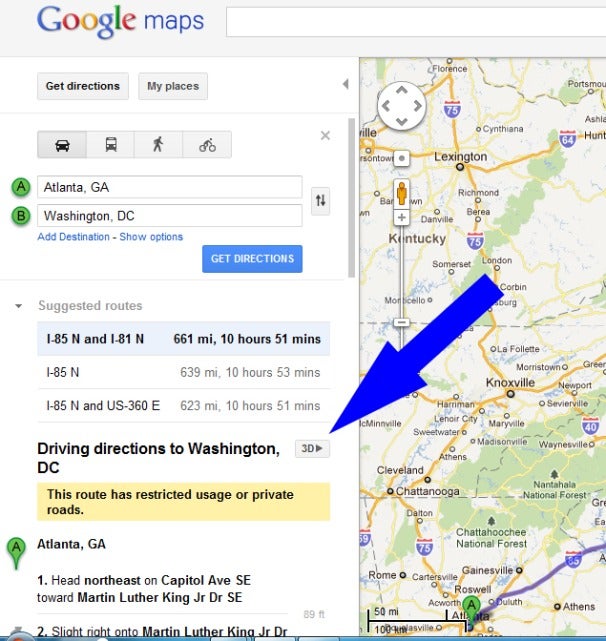
Click on it and your once two-dimensional route comes to life in Google’s Web-based version of Google Earth. Now views allow you to see 3D rendering of elevations such as buildings, hills and mountains as Google flies you along your recommended route.
You can pause the flight by clicking anywhere in the 3D view or on the pause button in the lower left of the map. While the flight is paused, you can explore the surrounding area in 3D by clicking and dragging the map.
For instance, you could take a break from your helicopter ride and click on photos, YouTube videos or Wikipedia pages that are geo-linked to locations along your route.

To resume the flight, you just click on the play button in the lower left of your map.
If you’re not sure which leg of the trip you’re seeing, just look to the left panel where it is highlighted in the directions. You can also use this pane to fast forward or reverse your virtual trip by clicking on a different step.
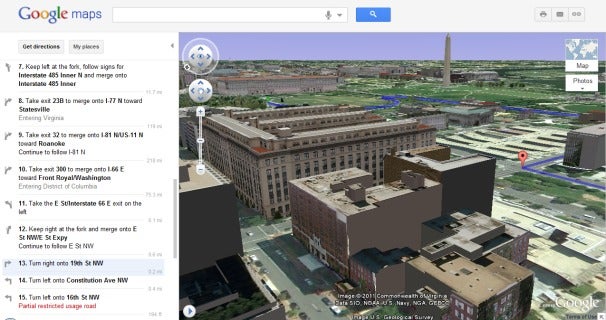
If the images here -- captured from a virtual trip from Atlanta to Washington, D.C. -- don’t impress you, check out the blog post from Google’s Earth and Maps team where they show photos from a picturesque drive from Carmel, California to Big Sur.
Either that, or play around with it yourself -- maybe taking a pretend trip from London to Paris, or Beijing to Shanghai. read more
Tuesday, September 20, 2011
Subscribe to:
Posts (Atom)